Qubi/biol200
The Tree of Life and Molecular Identification of Microorganisms
Objective
- To classify microorganisms and determine their relatedness using molecular sequences.
Lab Report Grading Policy
- Introduction (1pt)
- Statement of objectives or aims of the experiment in the student’s own words. This is not to be copied from the Lab Manual.
- Materials and Methods (0pts)
- This should be a brief synopsis and must include any changes or deviations from the procedures outlined in the Lab Manual. Specify which organisms were used to create the phylogram.
- Results (4pts)
- A print out of the phylogram will suffice.
- Discussion (4pts)
- Answer discussion questions.
- Summary/Conclusion (1pt)
- A sentence or two will suffice
- References (1pt)
- Credit is given for pertinent references obtained from sources other than the Lab Manual. This point is in addition to the 10 for the lab report.
Introduction
Evolution can be defined as descent with modification. In other words, changes in the nucleotide sequence of an organsim’s genomic DNA is inherited by the next generation. According to this, all organisms are related through descent from an ancestor that lived in the distant past. Since that time, about 4 billion years ago, life has undergone an extensive process of change as new kinds of organisms arose from other kinds existing in the past.
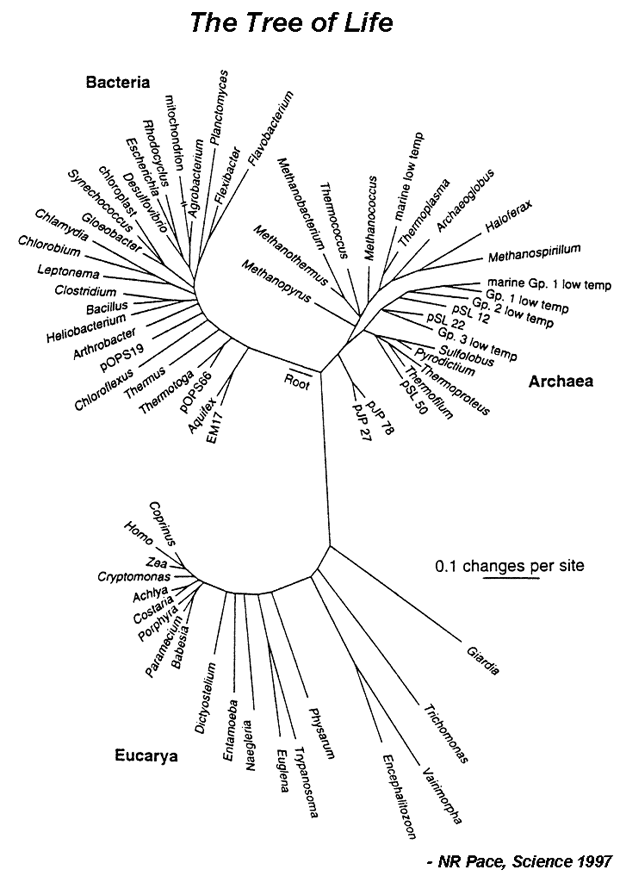
The evolutionary history of a group is called a phylogeny, and can be represented by a phylogram [Figure 1]. A major goal of evolutionary analysis is to understand this history. We do not have direct knowledge of the path of evolution, as by definition, extinct organisms no longer exist. Therefore, phylogeny must be inferred indirectly. Originally, evolutionary analysis was based upon the organisms’ morphology and metabolism. This is the basis for the Linnaean classification scheme (the “Five Kingdoms” scheme). However, this method can lead to mistaken relationships. Different species living in the same environment may have similar morphologies in order to deal with specific environmental factors. Thus these similarities have nothing to do with how related the organisms are, but are a direct result of shared surroundings. However, with the advent of genomics, organisms can be grouped based upon their sequence relatedness. Since evolution is a process of inherited nucleotide change, analyzing DNA sequence differences allows for the reconstruction of a better phylogenetic history.
Of course, when comparing DNA sequences, the question of which genes to use arises. The most widely used genes are those coding for the 16S rRNA gene in prokaryotes and the 18S rRNA gene in eukaryotes. These genes code for small subunit ribosomal RNA and are used for evolutionary analysis because they 1) are found in all organisms, 2) are functionally conserved, 3) vary only slightly between organisms (their nucleotide sequence changed slowly throughout evolution), and 4) have adequate length. In this lab, you will be performing evolutionary analysis by constructing a phylogram of 15 microbes spanning bacteria, archaea and eukarya. You will find and download rRNA sequences, align them and use that alignment to create a phylogram.
Materials and Methods
In this bioinformatics exercise, you will perform analysis of data from a microarray study of yeast cells by DeRisi et al (1997). At the time of the study, while many genes involved in glucose utilization had been identified, it was not clear what other genes in the yeast genome might also be involved. Furthermore, although the genome-sequencing project revealed a total of about 6,000 Open Reading Frames (ORFs, consisting of known and hypothesized genes) in the yeast genome, the functions of most of these genes were unknown. The microarray study by DeRisi et al (1997) had thus two main purposes. The first goal was to identify all genes in the yeast genome that are involved in glucose metabolism. The second goal was to characterize functions of unknown genes based on their patterns of gene expression during a physiological change.
The approach of the DeRisi study is to use Yeast Genome Chips to take snap shots of gene expression of the yeast genome at 2hour intervals during cell growth. During the course of the experiment, the yeast cells underwent the “diauxic shift” from anaerobic glucose fermentation (in which alcohol is produced) to aerobic respiration (in which alcohol is used as the carbon and energy source after the glucose is exhausted). The Yeast Genome Chip is a high-density microscopic glass slide printed robotically with oligonucleotide probes, each of which is specific to one of the 6,400 ORFs found in the yeast genome.
At each time point, an experimental sample was created by extracting cellular mRNAs and reverse transcribing the mRNAs into cDNAs in the presence of the Cy5 (a fluorescent dye, shown in red) labeled dUTPs. A reference sample was made from the cells at the start of the experiment and was labeled with another fluorescent dye Cy3 (shown in green). The experimental sample and the reference were mixed and applied to the Yeast Genome Chip. After hybridization and excessive samples washed away, the DNA chip was measured for fluorescent intensity of both the Cy3 and Cy5 dyes (Figure 1 & 2). At each probe location on the DNA chip, the relative ratio of the Cy5/Cy3 intensities reveals the level of expression of a particular gene relative to that of the reference (startingpoint) sample.
Procedures
- Access the NCBI website: http://www.ncbi.nlm.nih.gov/
- Under the “Search” category, select “Nucleotide”.
- Under the “for” category, type the accession number for your first organism, and hit the “Go” button. This takes you to the access for the 16S rRNA for your organism.
- Download the 16S rRNA sequence for your first organisms by choosing “FASTA” under the “Display” category.
- Copy and paste the entire output into a Microsoft Word file.
- Edit the sequence id to match the format of “Genus_Species_Genbank#” (eg. > Escherichia_coli_174375).
- Repeat process for all of your organisms, pasting the sequences into the same Microsoft Word file. *Note: Be sure to place a blank line between each sequence entry.
- Access the EMBL CLUSTALW alignment website: http://www.ebi.ac.uk/Tools/clustalw/, and copy and paste your entire Microsoft Word file into the area which asks you to “Enter or paste a set of sequences in any supported format”. Click “Run”. This program will make an alignment of all of your sequences..
- Click “Show as Phylogram Tree” to create a tree showing the relatedness of your organisms based on their 16S rRNA sequences.
- To print your phylogram tree:
- a) hit the “Print Screen” button on your keyboard
- b) open the Paint program from your “accessories” menu on your computer
- c) hit "paste" to paste your screen
- d) “select” your phylogram tree
- e) copy and paste it into a new paint file
- f) print your tree and email it to yourself.
Table 1. Representative species from each major group in Bergey’s Manual
|
Volume 1A (Gram-negative bacteria) | |
|
Escherichia coli |
ACCESSION #174375 |
|
Helicobacter pylori |
ACCESSION #402670 |
|
Salmonella typhi |
ACCESSION #2826789 |
|
Serratia marcescens |
ACCESSION #4582213 |
|
Treponema pallidum |
ACCESSION #176249 |
|
Additional species: Agrobacterium tumefaciens, Boredetella pertussis, Thermus aquaticus, Yersinia pestis, Borrelia burgdorferi. (Note: To search for unlisted 16S sequences, type key words such as “yersinia AND 16S [gene]” in the NCBI GenBank search box.) | |
|
Volume 1B (Rikettsias and endosymbionts) | |
|
Baronella bacilliformis |
ACCESSION #173825 |
|
Chlamydia trachomatis |
ACCESSION #2576240 |
|
Rickettsia rickettsii |
ACCESSION #538436 |
|
Additional species: Coxiella burnetii, Thermoplasma acidophilum | |
|
Volume 2A (Gram-positive bacteria) | |
|
Bacillus subtilis |
ACCESSION #8980302 |
|
Dinococcus radiodurans |
ACCESSION #145033 |
|
Staphylococcus aureus |
ACCESSION #576603 |
|
Additional species: Bacillus anthracis, Clostridium botulinum, Lactobacillus acidophilus, Streptococcus pyogenes | |
|
Volume 2B (Mycobacteria and nocardia) | |
|
Mycobacterium haemophilum |
ACCESSION #406086 |
|
Mycobacterium tuberculosis |
ACCESSION #3929878 |
|
Additional species: Mycobacterium bovis, Nocardia orientalis | |
|
Volume 3A (Phototrophs, chemolithotrophs, sheathed bacteria, gliding bacteria) | |
|
Anabaena sp. |
ACCESSION #39010 |
|
Cytophaga latercula |
ACCESSION #37222646 |
|
Nitrobacter wiogradskyi |
ACCESSION #402722 |
|
Additional species: Heliothrix oregonensis, Myxococcus fulvus, Thiobacillus ferrooxidans | |
|
Volume 3B (Archeobaceria) | |
|
''Methanococcus jannaschii |
ACCESSION #175446 |
|
Thermotoga subterranean |
ACCESSION #915213 |
|
Additional species: Desulfurococcus mucosus, Halobacterium salinarium, Pyrococcus woesei | |
|
Volume 4 (Actinomycetes) | |
|
Actinomyces bowdenii |
ACCESSION #6456800 |
|
Actinomyces neuii |
ACCESSION #433527 |
|
Actinomyces turicensis |
ACCESSION #642970 |
|
Eukaryotic representative (used as outgroup for rooting the phylogenetic tree) | |
|
Saccharomyces cerevisiae |
ACCESSION #172403 |
Analyzing your phylogram
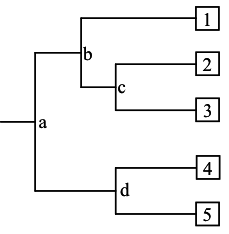
A phyolgram is composed of nodes and branches [Figure 2]. The internal nodes represent extinct ancestors, and the tips of the branches, also called nodes, are individual strains of microorganisms that exist now, and from which the sequence data were obtained. The internal nodes are points in evolution where an extinct ancestor diverged into two new entities, each of which began to accumulate differences during its subsequent independent evolution. The branches define the order of descent and the ancestry of the nodes. The branch length represents the number of changes that have occurred along that branch. Thus, the more recently two organisms share a common ancestor, the more closely related they are. Trees can be either “unrooted” or “rooted”. Unrooted trees show the relationships among the microorganisms under study, but not the evolutionary path leading from an ancestor to a strain. A rooted tree shows the unique path from an ancestor (internal node) to each strain. Trees are rooted by inclusion of an outgroup in the analysis. An outgroup is an organism that is less closely related to the other organisms under study than the organisms are to each other.
Discussion Questions
- Answer the following questions based on a Tree of Life shown in Figure 1:
- a) What do internal and terminal nodes represent?
- b) What do branch lengths represent? What’s the unit and meaning of the scale bar?
- c) Identify the positions of Humans (Homo), corn (Zea), E.coli, and Bacillus on the tree. Use the scale bar to estimate which pair is evolutionarily more distant: human/corn or E.coli/Bacillus?
- In Figure 2, which two species are more closely related: 1 and 2, 2 and 3, or 1 and 4? Which are more distantly related? How did you determine this?
- In Figure 2, is 1 more, less, or equally related to 4 and 5? Explain your rationale.
- List and describe the key steps of constructing a phylogenetic tree.
- Why do we use 18S rRNA information for yeast and 16S for prokaryotes? Could we use other molecules as phylogenetic markers? What constitutes a “good” phylogenetic marker for building a tree of life?
Bonus Question:
- Define 16S “phylo-species” and “metagenomics”. Describe how PCR amplification and sequencing of 16S rRNA molecules from environmental microbial samples (e.g., sea water, soil, human gut, hot springs) can be used to define species composition of an environment.
References & Resources
- Jungck, J. R.; Fass, M.F.; Stanley, E. D. (ed.). 2003 (2006 Revision). Microbes Count! Problem Posing, Problem Solving, and Peer Persuasion in Microbiology. BioQUEST Curriculum Consortium. (Chapter 6, pg 191)
- Holt. J. G. Editor-in-Chief (1984). Bergey’s Manual of Systematic Bacteriology, Volume 1-4. Williams & Wilkins: Baltimore. http://www.cme.msu.edu/bergeys/pubinfo.html

